Enabling Data-Driven Decisions for Healthcare Enterprises
Address the ever-growing need for digital reporting and analytics in healthcare with SmartHealthAnalytics. A digital reporting solution powered by the SmartHealthConnect big data hub, SmartHealthAnalytics provides Business Intelligence (BI) reporting and analytical insights across Revenue Cycle Management (RCM), Provider Data Management (PDM), Clinical informatics, and beyond.
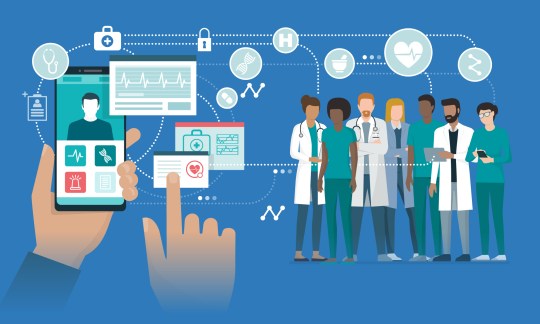
Our solution provides ready-to-use digital reports and analytical insights via interactive dashboards, a mobile app, real-time alerts, and self-service BI, with zero dependency on IT teams.
Features and Benefits
All-in-One Reporting
Sutherland SmartHealthAnalytics handles 8 million+ transactions per month, providing RCM, PDM BI/analytics dashboards, and alerts for 20+ healthcare customers.
Customized Dashboards
Gain a holistic view of your organization or drill down to specific data points online.
Self-Service BI/Reporting
Allow end-users to create ad-hoc reports and dashboards on their own with zero dependency on IT teams.
Enterprise Data Management, BI, Analytics Under One Roof
Ensure better data-driven decision-making, powered by predictive and prescriptive analytics for clinical and financial datasets.
Access From Anywhere
Use the Intellie mobile app to access analytics insights on the move through KPI dashboards with prospective alerts and push notifications.
Why Sutherland
Industry-Leading Innovation
1M+ transactions per month. Powered by 363 unique and independent inventions rolled up under several patent grants, Sutherland’s AI-driven products and platforms empower businesses to innovate, streamline processes, and deliver exceptional experiences.
Predictive Analytics
30% + improved collections and denial conversions. Utilize predictive modeling and forecasting techniques to anticipate future trends and patient outcomes such as propensity to pay, readmission prediction, and more.
Enhanced Operational Efficiency
25%+ productivity improvements. Optimize resource allocation and streamline operations by identifying inefficiencies, bottlenecks, and opportunities for improvement within healthcare processes.
Performance Monitoring
Track KPIs and metrics in real time with self-service BI, allowing stakeholders to monitor performance against goals, identify deviations, and take corrective actions as needed.


